


Tour de France 2026: Why aero bikes make all the difference on the Ballon d’Alsace
Robert Kühnen
· 17.07.2026

The world’s best cyclists will be competing in the Tour de France until 26 July. Victory and defeat on the roads of France are decided not only by the riders’ legs, but also by their equipment. The TOUR Tech Briefing for Stage 13.
We’ve got a balloon ride planned for today. Although it takes a long climb to reach the balloon, and it’s actually quite a slog. The Ballon d’Alsace is a peak in the Vosges. At 8.9 kilometres long with an average gradient of 6.9 per cent, this 1,173-metre-high pass qualifies as a first-category climb. That’s enough to make up a fair bit of time.
From the summit, the route continues for a further 30 kilometres, initially with a steep descent, which then becomes much gentler as it approaches the finish.
Under normal circumstances, this would be a stage for breakaway riders, who are allowed to pull well clear and whose lead shrinks on the final climb. Depending on their form, they might well have hopes of winning the stage. But we are, after all, living in the Pogacar era, and different rules apply there.
Will the Dominator go for another stage win? Will he not care that it is still a long way from the summit to the finish line, or that there are risks lurking which could jeopardise his seemingly secure overall victory if he breaks away alone at the Ballon?

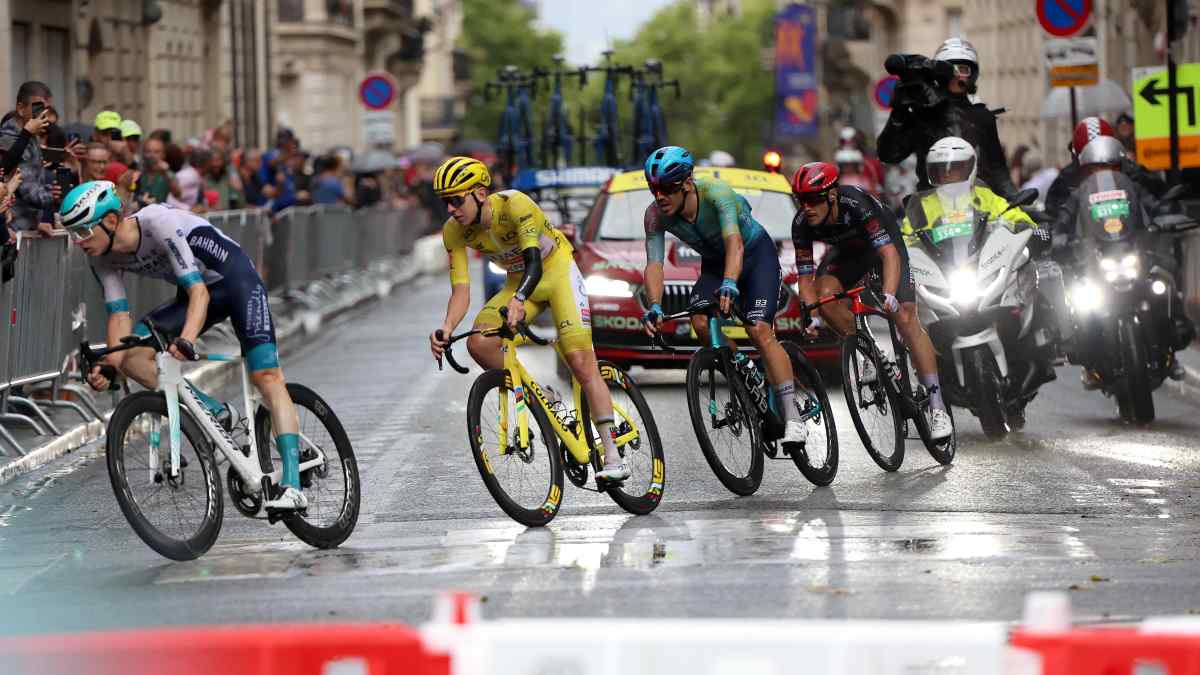
During his final solo breakaway on the tenth stage, Pogacar did indeed close the gap on Richard Carapaz in record time, but compared to the riders in the second group, he did not appear quite as effortlessly dominant at the finish as on many other occasions. It was an early indication that even Pogacar could one day overplay his hand.
If the others can’t bring him down, perhaps he’ll manage it himself?
We’ll see.
But let’s get down to the technical side of things. Breakaway riders hoping to make a move should opt for aero kit – that much is clear. After all, the approach is long, and the climb isn’t enormous or particularly steep.
Anyone who has been following the briefing up to this point will have realised that the energy savings achieved through the use of Aero material are by far the most significant factor for this type of route profile.
But how many minutes’ head start can the bike really be credited with?
Number of the day: 8 minutes 26 seconds – 6 kilometres ahead
In the simulation, we send breakaway riders onto the course who attack early and let them go all out. We take into account that they won’t be at their freshest on the climb, but that they’ll keep moving and then hurtle down the descent at breakneck speed.
Under these circumstances, the fastest bike in the field a lead of 8 minutes and 26 seconds – the equivalent of just under 6 kilometres ahead of the slowpoke in our rankings, the Cervelo R5. That’s a clear lead!
An overview of the (almost) full line-up*:

The table shows that a long breakaway, with the climb at the end, benefits greatly from fast-rolling aero kit – in fact, very much so. The lightweight wheels can stay in the van.
The “Aero-Power” figure shown is the power measured by TOUR in the wind tunnel as required to overcome the aerodynamic drag of the bike and a dummy with moving legs at 45 km/h. For the simulation, we mathematically add the rider’s upper body and scale the drag to the actual race speed.
Stage 11 review: The sprint that wasn’t a sprint
The eleventh stage took a curious turn: drawing on the experience of the Tour’s first week, the sprinters’ teams kept the expected breakaway riders on a tight leash (allowing them a lead of around one and a half minutes) and reeled them in, as planned, shortly before the finish. A side effect of this tactic and the tailwind was the fastest average speed recorded so far in a Tour de France stage: 50.91 km/h! It is astonishing enough that the breakaway riders were able to stay in the lead for so long despite this breakneck pace.
Shortly before the 5,000-metre mark, the breakaway riders were caught. The pace of the peloton then dropped off, as no sprint team wanted to start their lead-out so early. It was only at the 2,000-metre mark that Biniam Girmay’s team kicked off the action. As the race progressed, however, no clear structure emerged. Several lead-out teams lost their sprinters. Alpecin held back – the expected change in tactics after perfect lead-outs failed to yield a result.
Amidst the chaos, Soren Warenskjold of Uno-X kept his cool and latched onto Olav Kooij’s lead-out man, Cees Bol, who had opened up a gap. Warenskjold’s sprint actually started far too early, but he was able to save a bit of energy in Bol’s slipstream before extending his lead towards the line.
From behind, the fastest sprinters were closing in – very close, in fact – but they were too late. Warenskjold won his 400-metre sprint thanks to his excellent timing. Efficiency beat top speed!
Technically speaking, it was the aerodynamic effects that kept Warenskjold in the race. Without Bol’s slipstream, he would not have been able to sustain such a long sprint; but without top-class aerodynamics, he would not have been able to hold his own at the front either. A good measure of anaerobic endurance also played a part.
The close result highlights that it makes sense for the professionals to fine-tune every aspect of their aerodynamics in order to maximise their chances of victory.
* Simulation calculations
Based on our own wind tunnel tests, we carry out simulation calculations for the Tour de France tech briefing. How TOUR tests: Aero road bike test in the wind tunnel.
We are investigating which wheels can offer a technical advantage in which situations. The variables we can influence in the simulation include wheel weight, rider weight, the inertia of the wheels, the drag coefficient, the rolling resistance coefficient and the efficiency of the drivetrain.
To model ride times, we use realistic power outputs and weights for the riders, combine these with our wind tunnel data, and have the riders race virtually along selected sections of the route, which we extract from the official route data; the derived elevation profiles are key to this. The modelling also includes bends, which we can brake for realistically, and adjustable power profiles for different types of riders. This allows us to distinguish between attacks on climbs and proper final sprints. Taken together, this makes the simulation very realistic. What we cannot replicate, however, are dynamic driving effects such as the individual behaviour of the wheels on different road surfaces.
The journey times calculated for the sections of the route that are decisive for the race highlight the influence of the wheels – provided that the riders always behave in the same way in a given scenario.

Robert Kühnen
Editor